Logging into Google Analytics 4 (GA4) for the first time is often a frustrating experience for most business owners. If you are used to the old Universal Analytics (UA) dashboard, where everything you needed was neatly packaged in a few familiar tabs, the GA4 interface likely feels like a chaotic spaceship control panel.
You are not alone in feeling overwhelmed. We hear this constantly from our clients at Go Citrine. The transition to GA4 disrupted years of established data-tracking habits, leaving many founders and marketing managers staring at blank screens, unsure of what is actually driving their revenue.
However, ignoring your analytics is not an option. Data is the lifeblood of modern business. Without it, your marketing budget is simply a series of expensive guesses. The good news is that you do not need to be a data scientist to extract immense value from GA4. You do not need to understand every single dropdown menu, custom exploration, or real-time event tag.
To make intelligent, revenue-generating decisions, you only need to focus on a handful of critical indicators. This guide demystifies the platform and breaks down the five essential metrics every business owner should track to protect their bottom line.
The Paradigm Shift: Why GA4 Feels So Different
Before we dive into the specific metrics, it is vital to understand why GA4 looks and acts the way it does. The confusion usually stems from a fundamental misunderstanding of how the new system records data.
Universal Analytics was built for an older version of the internet. It was a session-based model. It tracked "pageviews" and "sessions," heavily relying on desktop users clicking from one URL to another.
GA4 is an event-based model. It was built for the modern, multi-device internet. Instead of just tracking when a page loads, GA4 tracks everything as an "event." A page loading is an event. A user scrolling down 50% of the page is an event. Clicking a play button on a video is an event. Adding a product to a cart is an event.
This shift makes GA4 incredibly powerful because it focuses on user behavior and engagement, rather than just raw traffic. It tells you not just who showed up, but exactly what they did once they arrived.
With that foundational shift in mind, let's explore the five metrics that actually matter.
1. Engagement Rate (The "New" Bounce Rate)
For years, business owners obsessed over "Bounce Rate." In Universal Analytics, a bounce occurred when a user landed on your website and left without clicking to a second page. But this metric was deeply flawed. If a user landed on a 3,000-word blog post, read the entire thing for ten minutes, got the exact answer they needed, and left, UA recorded that as a "bounce"—a negative interaction.
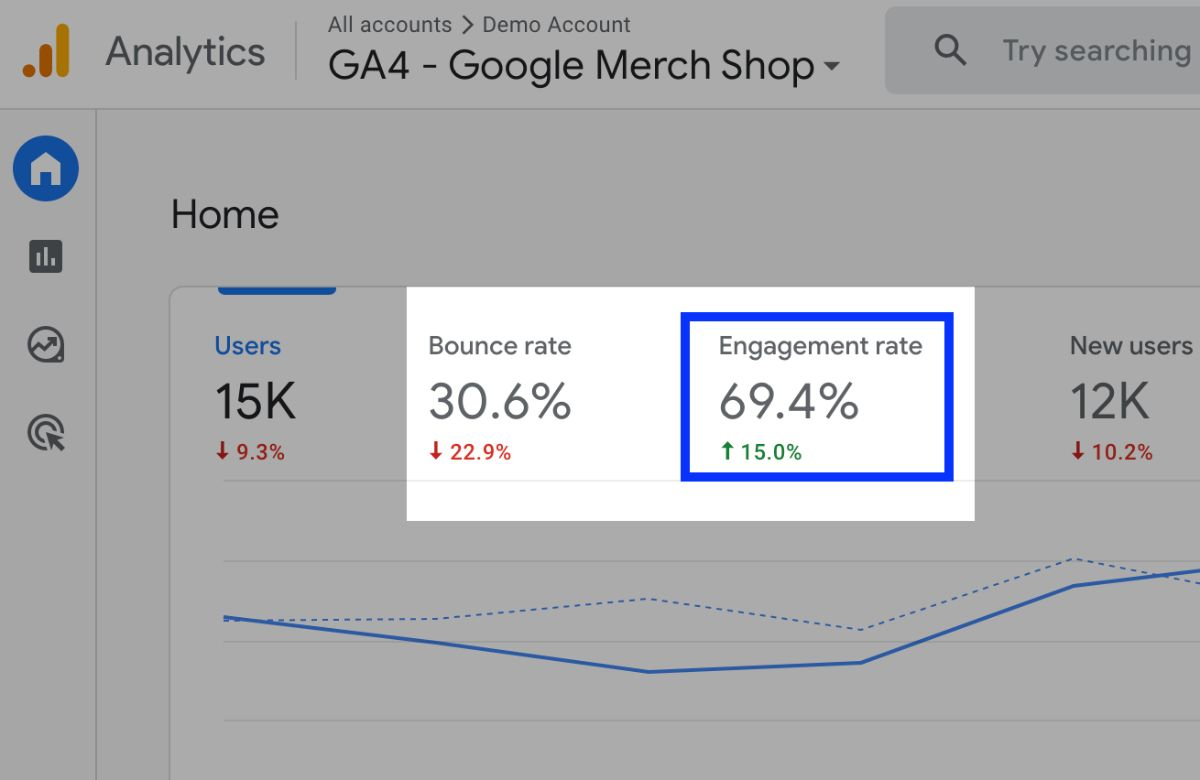
GA4 fixes this flaw by replacing Bounce Rate with Engagement Rate.
An "Engaged Session" in GA4 is defined as any session that meets at least one of the following criteria:
- The user stays on the page for longer than 10 seconds.
- The user completes a conversion event (like filling out a form or making a purchase).
- The user views two or more pages.
Why It Matters to Your Bottom Line:
Engagement Rate tells you if your marketing promises match your website’s reality. If you are running expensive Google Ads, but your Engagement Rate is a dismal 15%, you are bringing the wrong people to your website, or your landing page is broken, slow, or confusing. A high engagement rate indicates that your content is resonating and your user experience is solid.
|
Metric |
Focus |
What It Tells You |
|
Old Bounce Rate |
Did they click another link? |
Very little about actual content consumption. |
|
New Engagement Rate |
Did they interact or stay for 10+ seconds? |
Whether your site is capturing and holding attention. |
How to Improve It:
If your Engagement Rate is low (typically under 40%), audit your page load speeds, ensure your text is scannable on mobile devices, and make sure your "Call to Action" buttons are highly visible.
2. Traffic Acquisition (Session Default Channel Group)
If you are going to invest thousands of dollars into SEO, social media management, and paid advertising, you need to know which of those channels is actually pulling its weight.
The Traffic Acquisition report (found under Reports > Lifecycle > Acquisition) is your financial compass. Specifically, you want to look at the "Session Default Channel Group" dimension. This categorizes your website traffic into neat buckets:
- Organic Search: Traffic from unpaid Google or Bing search results (your SEO efforts).
- Paid Search: Traffic from your Google Ads or Microsoft Ads campaigns.
- Organic Social: Traffic from your standard posts on Instagram, LinkedIn, TikTok, etc.
- Paid Social: Traffic from your Meta Ads or LinkedIn Ads.
- Direct: Users who typed your URL directly into their browser or used a bookmark.
- Referral: Traffic from links on other websites.
Why It Matters to Your Bottom Line:
This metric dictates resource allocation. If your data shows that Organic Search is driving 70% of your highly engaged traffic, but you are spending 80% of your marketing budget on Paid Social, your strategy is misaligned. Traffic Acquisition allows you to double down on the channels that are working and cut funding to the ones that are failing.
How to Use It:
Do not just look at the raw volume of users coming from each channel. Cross-reference your Traffic Acquisition with the Engagement Rate and Key Events to see which channel brings in the highest quality traffic, not just the most traffic.
3. Key Events (Formerly Conversions)
In early 2024, Google updated GA4 terminology, renaming standard "Conversions" to Key Events. (The term "Conversions" is now strictly reserved for actions shared directly with Google Ads to optimize bidding). Regardless of the name, Key Events are the most important metric on your entire dashboard.
A Key Event is any user action that is directly valuable to your business.
Because GA4 tracks everything as an event (scrolling, clicking, viewing), you must manually tell the platform which of those events are "Key." For an e-commerce store, a Key Event is a completed purchase. For a B2B agency or service provider, a Key Event is a submitted lead generation form, a booked calendar appointment, or a clicked "Call Now" phone number.
Why It Matters to Your Bottom Line:
Traffic without Key Events is just a vanity metric. It does not matter if your website receives 50,000 visitors a month if zero of them request a quote or buy a product. Tracking Key Events allows you to calculate your true return on investment (ROI).
How to Use It:
By setting a monetary value to your Key Events (e.g., telling GA4 that every lead form submission is worth an average of $50 to your business pipeline), you can instantly see the projected revenue generated by your website on any given day. If Key Events drop abruptly, you know immediately that a link is broken, a checkout gateway has failed, or a new ad campaign is completely missing the mark.
4. Conversion Paths (Understanding the Customer Journey)
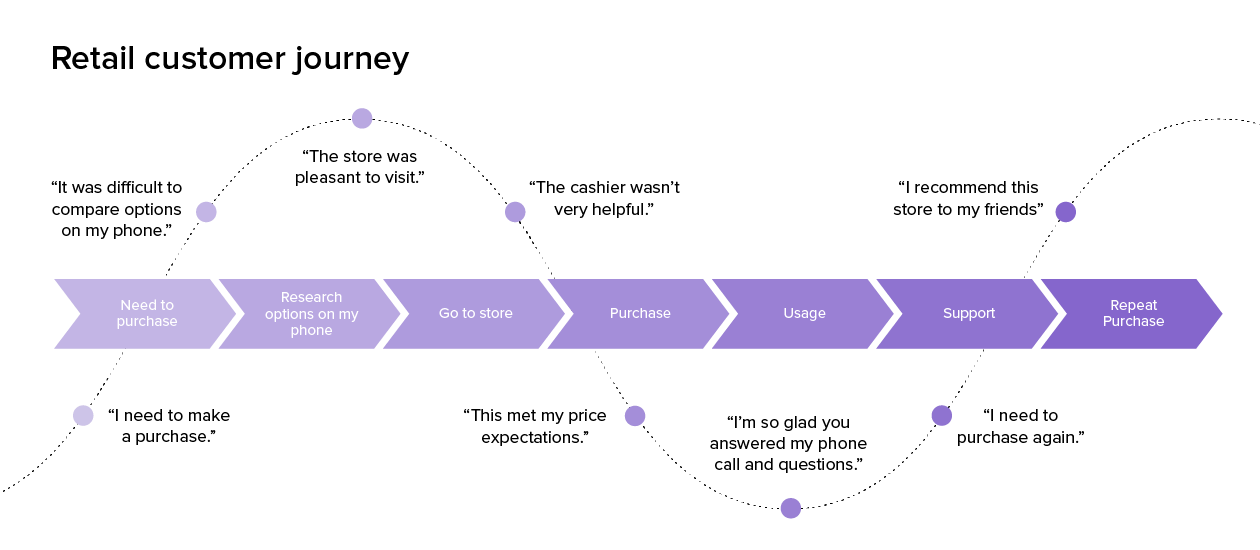
In the real world, the buying process is rarely linear. A customer does not simply see an ad for the first time, click it, and instantly drop $5,000 on a service or $200 on a pair of shoes.
They might see a Facebook Ad on Monday on their phone and scroll past it. On Wednesday, they remember your brand and Google your name (Organic Search). On Friday, they click a retargeting ad on a blog they are reading (Display Ad) and finally make the purchase.
Universal Analytics used a "Last-Click" attribution model, meaning it would give 100% of the credit for that sale to the Display Ad on Friday, completely ignoring the Facebook Ad and the Organic Search that introduced the buyer to the brand.
GA4 solves this with the Conversion Paths report (found under Advertising > Attribution). It uses data-driven attribution to show you the entire multi-touch journey a customer takes before triggering a Key Event.
Why It Matters to Your Bottom Line:
If you only look at last-click data, you might falsely conclude that your Top-of-Funnel social media ads are a waste of money because they rarely result in immediate, direct sales. You might turn those ads off to save cash. But Conversion Paths will reveal that those social ads are actually initiating the journey for 60% of your total buyers. Turning them off would unintentionally strangle your overall sales.
This metric prevents you from accidentally cutting off the top of your sales funnel.
5. User Lifetime Value (LTV)
Customer acquisition is notoriously expensive. Between ad spend, agency fees, and content creation, it often costs significantly more to acquire a new customer than it does to retain an existing one.
GA4 introduces much stronger predictive metrics than its predecessor, and User Lifetime Value (LTV) is a game-changer for e-commerce and subscription-based businesses. Found in the Explore section, LTV calculates the total revenue a specific cohort of users has generated over their entire relationship with your website, spanning from their very first visit to their most recent purchase.
Why It Matters to Your Bottom Line:
LTV completely changes how you calculate your marketing budget. For example, if you run a subscription coffee company, and it costs you $30 in Google Ads to acquire a customer who buys a $20 bag of coffee, your initial reaction might be to panic. You are losing $10 per sale.
However, if your GA4 LTV tracking shows that the average customer buys that same $20 bag every month for an average of 14 months, their true Lifetime Value is $280. Suddenly, spending $30 to acquire them is an incredibly profitable business move.
How to Use It:
Use LTV to segment your audience. Identify which marketing channels bring in customers with the highest LTV (the loyal, repeat buyers) versus channels that bring in one-off, discount-seeking buyers. Reallocate your ad spend to clone the high-LTV audience.
Stop Drowning in Data, Start Driving Revenue
Google Analytics 4 is an incredibly complex tool, but you do not need to master its deepest technical intricacies to be an effective business owner. By ignoring the noise and zeroing in on Engagement Rate, Traffic Acquisition, Key Events, Conversion Paths, and Lifetime Value, you transition from simply collecting data to actively using it.
These five metrics tell you if your website is functioning, where your most valuable customers are coming from, what they are doing before they buy, and how much they are ultimately worth to your business.
At Go Citrine, we understand that you want to run your business, not spend hours a week untangling analytics dashboards. Our team of data specialists sets up customized, easy-to-read GA4 dashboards tailored specifically to your goals. We handle the complex event tracking and attribution modeling so you can log in, instantly see the metrics that drive your bottom line, and get back to doing what you do best.